Detailed Forecasts & Flood Intelligence
Real-time satellite imagery, river forecasts, and flood monitoring for Pacific Northwest Tribes
Your Selected Community
Loading...
7-Day Precipitation Forecast
QPF
📊 Daily Breakdown — Pacific Northwest
Expected rainfall amounts by day
Heavy (>1")
Moderate (0.25-1")
Light (<0.25")
Days 1-3
3.6"
Days 4-7
1.5"
7-Day Total
5.1"
Reading the Forecast
Map colors: Green = light rain, blue = moderate, purple = heavy accumulation.
Bar heights: Taller bars indicate heavier daily rainfall expected.
Percentages: Probability of measurable precipitation (≥0.01") for that day.
Flood risk: Multiple days with >0.5" or any day >2" warrants close monitoring.
Bar heights: Taller bars indicate heavier daily rainfall expected.
Percentages: Probability of measurable precipitation (≥0.01") for that day.
Flood risk: Multiple days with >0.5" or any day >2" warrants close monitoring.
GOES-18 Satellite
LIVEData Unavailable - Switching View...
Atmospheric River Tracking — TPW
LIVETotal Precipitable Water (TPW)
This animation shows moisture content in the atmosphere. Bright plumes of white/yellow indicate atmospheric rivers—narrow corridors of concentrated water vapor that can deliver heavy precipitation to the PNW.
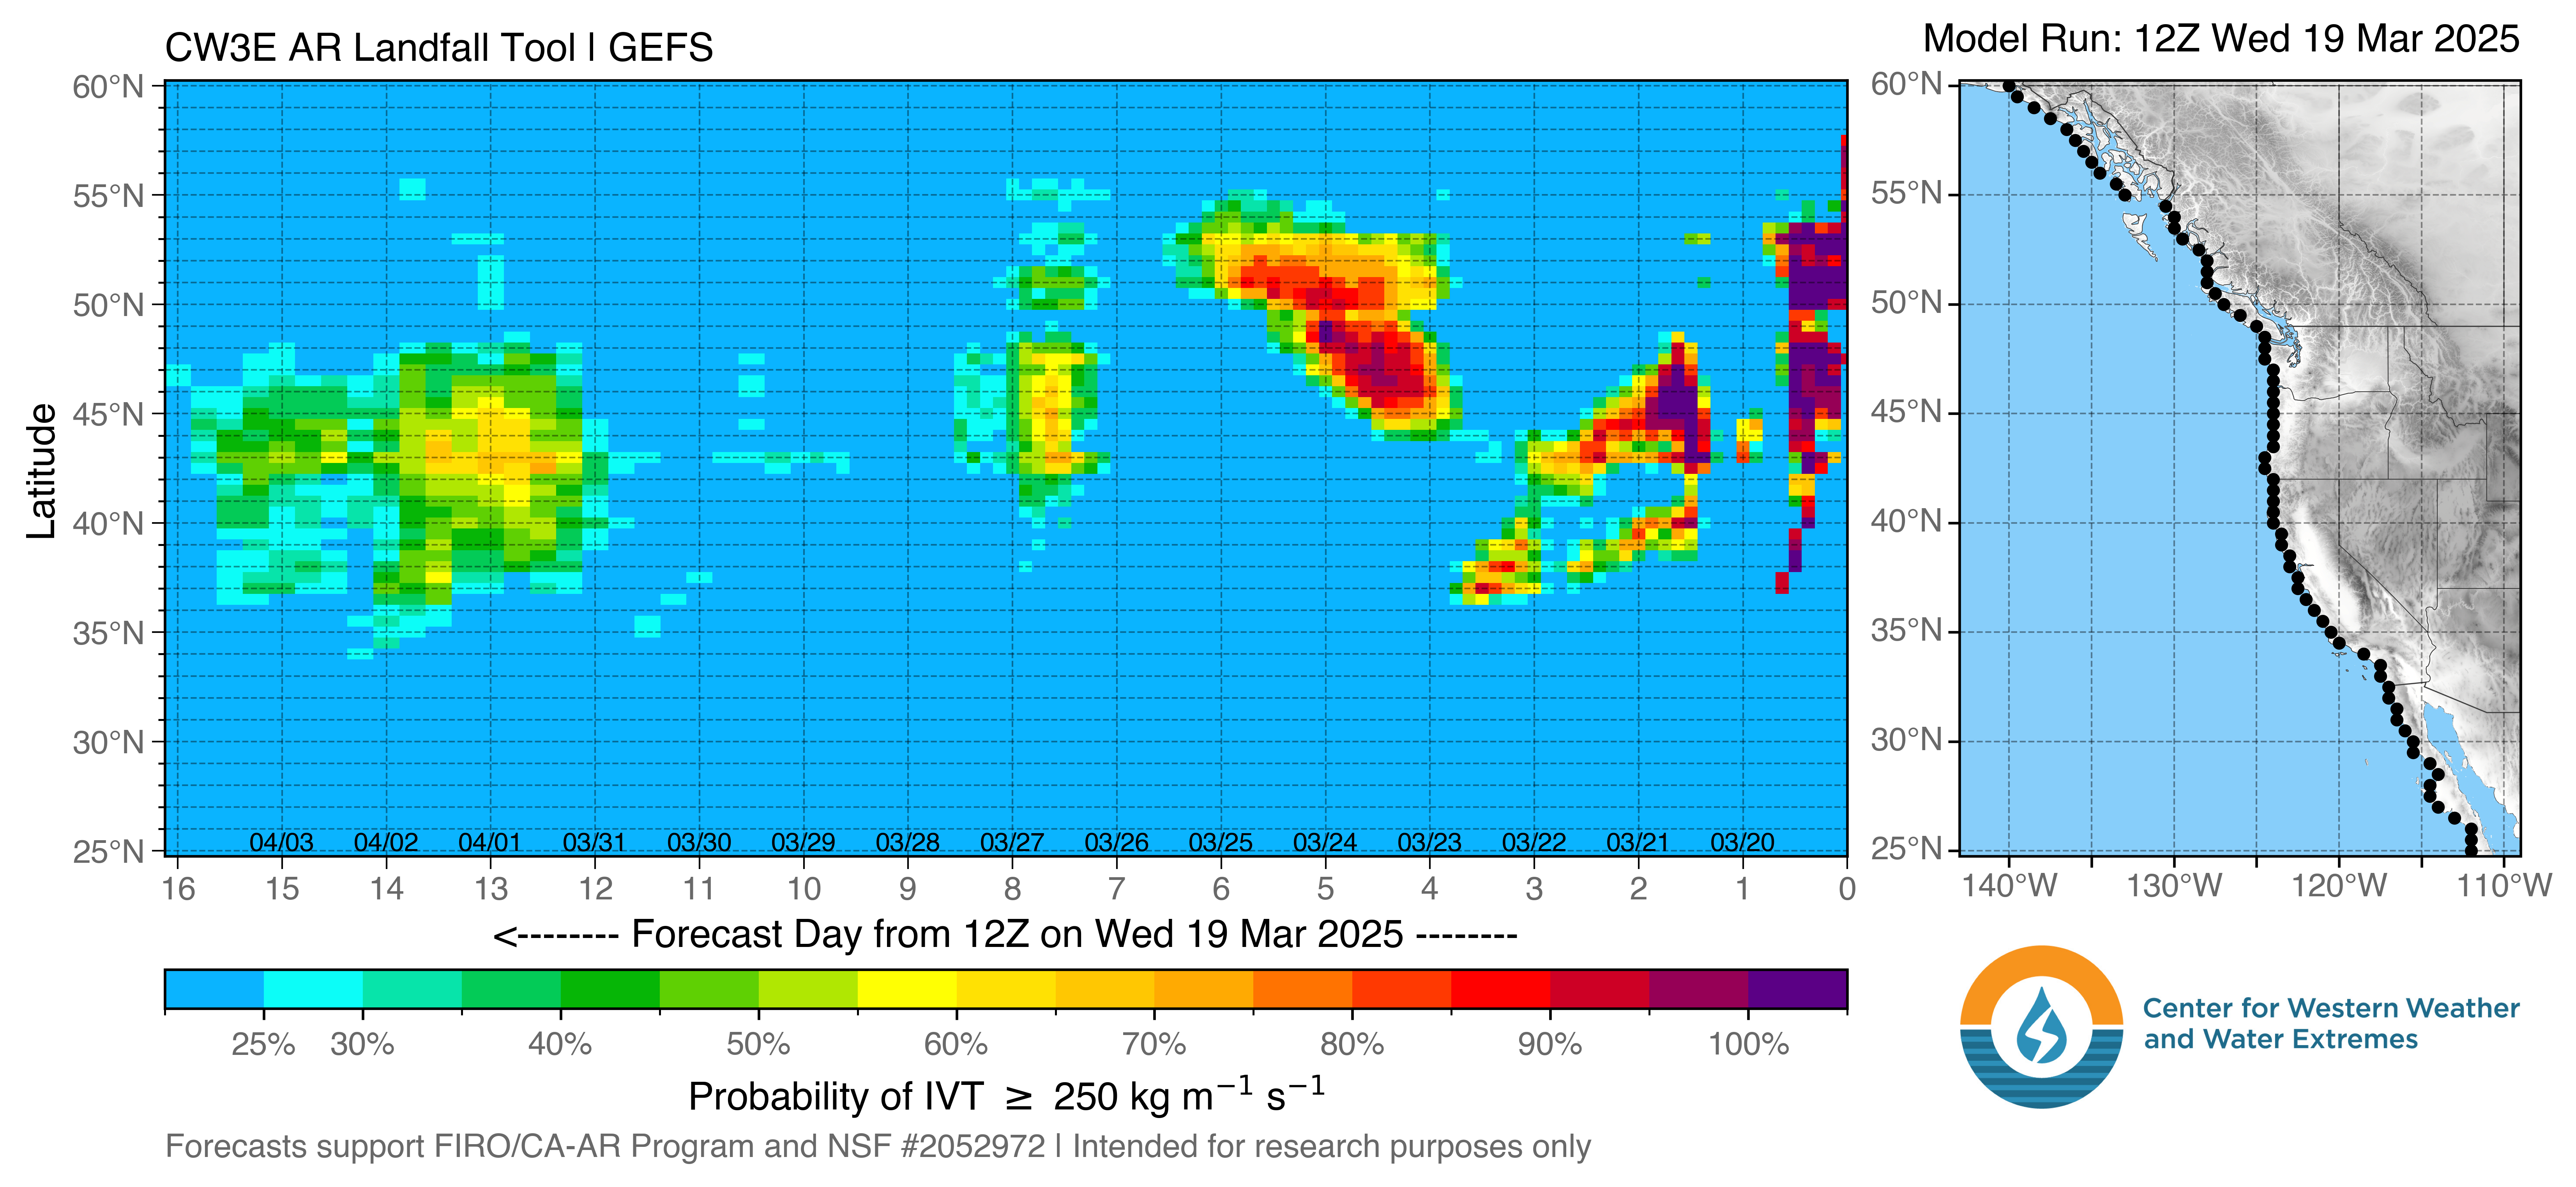
AR Landfall Probability — 16 Day
ForecastInterpreting the Forecast
Shows probability of atmospheric river conditions making landfall along the West Coast over 16 days. Warmer colors (orange/red) = higher probability of significant moisture events.
Active Radar — PNW Regional
ANIMATED
Regional composite covering WA, OR, ID
Light
Moderate
Heavy
Mixed
Snow
7-Day Weather Forecast
Select a Tribal Community above to get a forecast for that location.
Select a tribal community to load forecast...
Excessive Rainfall Outlook
WPCUnderstanding the Outlook
Shows probability of excessive rainfall leading to flash flooding. Risk categories: Marginal (green), Slight (yellow), Moderate (orange), High (red).
Active Flood Alerts — PNW
Loading
Loading alerts...
Wind & Weather Hazards
Loading alerts...
Flood Inundation Mapping — Pacific Northwest
LIVEUnderstanding Flood Inundation Maps
These maps show where flooding is occurring or forecast to occur. Blue shading indicates inundated areas. Use the layer controls on the map to toggle between current conditions and 5-day forecasts. Click on gauge icons to view hydrographs.
River Gauge Selection
National Weather Service — PNW Offices
State Emergency Management & Severe Weather
Flood Inundation & Mapping Resources
NOAA Flood Inundation Mapping (FIM)
Provides near-real-time, high-resolution street-level visualizations of current and forecasted flood waters. Now available for 60% of the US population including most of the Pacific Northwest.
NWPS Flood Maps
Interactive flood inundation mapping with street-level detail
USGS FIM Mapper
Explore flood scenarios at specific gauge locations
FEMA Flood Maps
Official FEMA flood zone maps and data
FloodSmart.gov
National Flood Insurance Program information
NWS Flood Map
Current flood watches and warnings nationwide
AHPS River Obs
Advanced Hydrologic Prediction Service
Ocean Levels & Coastal Monitoring
NOAA Tides & Currents
Real-time tide predictions and water levels
Sea Level Rise Viewer
Coastal flooding and sea level rise visualization
NDBC Buoys
National Data Buoy Center - offshore conditions
Marine Weather
NWS marine forecasts and warnings
Tsunami Warning
NOAA Tsunami Warning Center
NANOOS
NW Association of Networked Ocean Observing Systems
Northwest River Forecast Center
About NWRFC
The NWS Northwest River Forecast Center serves Washington, Oregon, and Idaho with river and flood forecasts, streamflow predictions, water supply forecasts, and hydrologic information to support flood warnings and water management.
NWRFC Home
Main portal for Northwest river forecasts
Water Supply Forecasts
Seasonal water supply predictions
NWS Seattle Hydrology
Western Washington flood info & forecasts
NWS Portland Hydrology
Oregon & SW Washington river data
USGS Real-Time Water
Current streamflow conditions nationwide
USGS WaterWatch
Maps of current water resources conditions
Atmospheric River Research & Data
Emergency Preparedness & Response
Ready.gov Floods
Federal flood preparedness guide
NWS Flood Safety
Official flood safety information
Disaster Assistance
Apply for federal disaster aid
FEMA Region 10
PNW federal emergency management
Red Cross Disaster
Disaster relief and recovery services
Wireless Alerts (WEA)
Emergency alerts to mobile devices
Emergency Contacts
Emergency Services
911
FEMA Helpline
1-800-621-3362
NWS Seattle
206-526-6087
NWS Portland
503-261-9246
NWS Boise
208-334-9860
NWS Spokane
509-244-0110